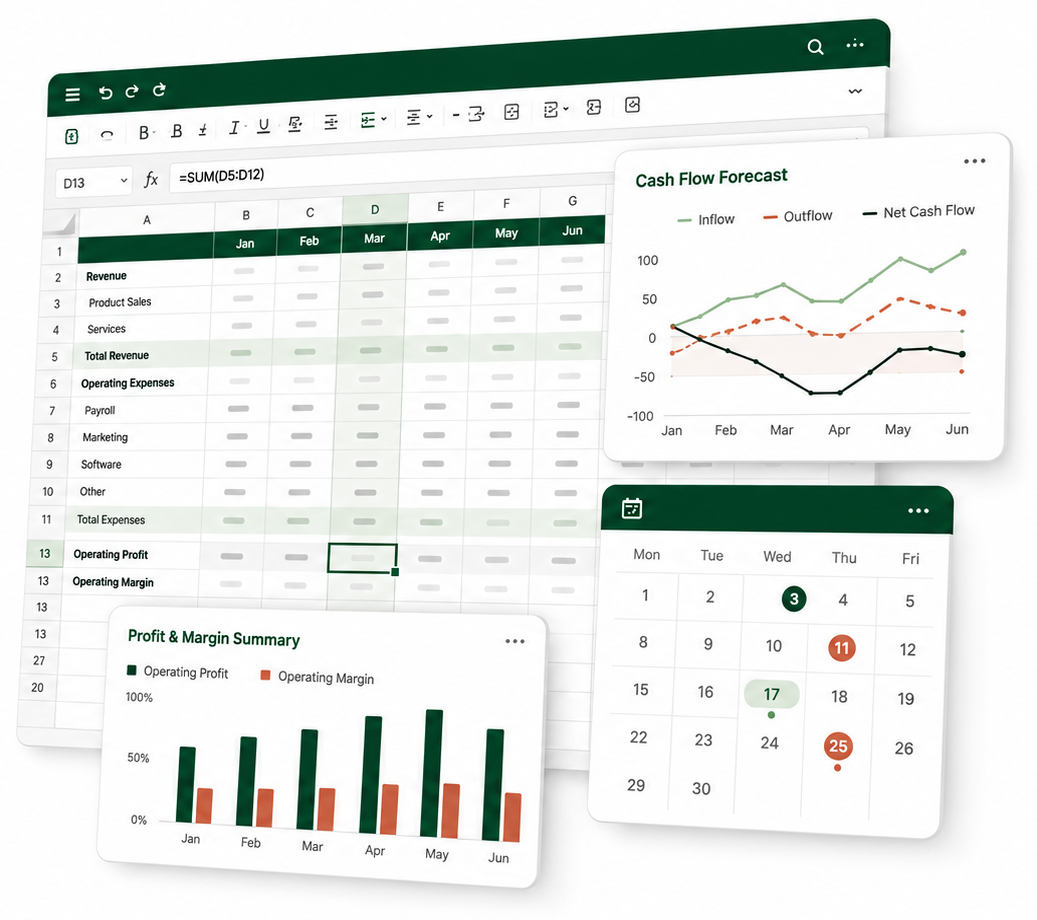
Know what makes money and what reduces your margin
Control your cash flow
Spot cash gaps early and avoid costly surprises
Plan confident growth
Know what you can safely invest and distribute
The sky's the limit. Cash is the runwayBreak ceilings. Not cash flowExcel is not a CFOYour bank balance is not a business modelYour bestseller might be losing you moneyYour numbers called. They're tired of being ignoredThe sky's the limit. Cash is the runwayBreak ceilings. Not cash flowExcel is not a CFOYour bank balance is not a business modelYour bestseller might be losing you moneyYour numbers called. They're tired of being ignored
Your next profit increase is already inside the business
Financial control
Money X-Ray
See where profit comes from, where cash goes and what your business can afford next
Bring profit, cash flow and forecasts into one clear view
See which products, clients and services make money
Tell us what you need and we’ll show you how GERA can help your business.
Frequently asked questions
Which industries do you work with?
We work with owner-managed businesses that have outgrown their bookkeeping typically AED 8–80M in revenue, often across several entities or locations, where there's an accountant but no finance function.
How does the work process look?
We're based in Dubai and we meet you in person, starting at your office, so we understand how the business really works. The reporting runs online, so nothing disrupts your team. We review the numbers with you face to face.
Can I use the service for a single project?
Yes, we take on one-off tasks as well as ongoing work, on whatever timeline fits your request.
What results can I expect?
A clear picture of your finances, higher profit, and decisions based on numbers instead of guesswork.
Why is outsourcing better than an in-house CFO?
You don't pay for vacations, sick leave, or training. You get experience across several industries at once, and you're not dependent on a single person on the team.
Method · Real estate portfolios
Where 1.4% hides in a property portfolio
No client is described here. This is the method we apply to portfolio work, and the places the basis points are usually found.
Managing buildings well and earning a good return are two different jobs.
A property team is measured on occupancy, tenant satisfaction, condition, compliance. All of it necessary. None of it is the same question as: is this asset earning its keep inside the portfolio? A building can be run beautifully and still drag the fund’s return, and nobody in the building will ever see it.
Why 1.4% is a large number
A portfolio’s total return is income return plus capital growth. On a single asset, 1.4% sounds like rounding. Across a portfolio it is not, for two reasons.
It applies to the whole asset base. The percentage is small; the base it multiplies is not. That is the arithmetic that decides whether a fund beats its benchmark or explains itself to investors.
It compounds for the length of the hold. A leak you close in year one keeps paying every year the asset is held. A leak you never find does the opposite, quietly, for the same period.
And unlike an operating business, the leaks rarely sit in one place. There is almost never a single bad decision to reverse. There are eight or ten small ones, each individually too small to argue about, which is exactly why nobody argues about them.
Where the basis points usually go
Void and re-letting timing. An empty month is a month of return that cannot be recovered later. Much of it is scheduling — notice periods, fit-out lead times, marketing started late — rather than market conditions.
Service charge recovery. Costs incurred on behalf of tenants but never fully recovered come straight out of net income. Small per line, persistent across a portfolio.
Financing sitting apart from performance. Debt cost is often managed by treasury and asset performance by the property team. Neither view shows the return the investor actually receives.
Capex timing. Works that land in the wrong year distort the return and often could have been phased without any operational cost.
Central costs spread evenly. Management and overhead allocated per asset rather than by what actually drives them makes weak assets look average and strong ones look worse than they are.
Holding past the peak. An asset kept beyond the point where its return has turned costs the portfolio every year it stays — and disposal decisions are the ones most easily postponed.
How we look for them
One net P&L per asset, built the same way for every asset in the portfolio: rent and other income, all direct costs, unrecovered service charge, allocated overhead by driver, financing, capex phased over its useful life. Then the same view again at portfolio level, so the assets can be ranked against each other rather than against their own budget.
Once every asset is comparable, the leaks stop being anecdotes and become a list — ordered by size, with an owner and a date against each one. That list is the whole point. Most of it is unglamorous: a re-letting process started six weeks earlier, a service charge schedule corrected, an overhead allocation rebuilt, one disposal that stopped being deferred.
None of those moves would justify a meeting on its own. Together they are the difference between benchmark and above it.
What to check in your own portfolio
Can you rank your assets by net return, today? Not by occupancy, not against budget — by what each one actually returns after everything. If not, that is the first job.
Is every asset costed the same way? Comparability matters more than precision. Two assets measured differently cannot be compared at all.
Is financing in the same view as performance? If they live in separate reports, nobody is looking at the number the investor receives.
Who owns the void clock? Re-letting timing is a process with a start date. If no one owns that date, it slips by default.
When did you last defend a hold decision? Assets are sold when someone makes a case. They are held when nobody does.
We’ve improved performance for large organisations across several sectors. We’ll walk through the results most relevant to you in a call.
18,000 assets, and no one could say how many were working
Details have been changed to protect the client’s confidentiality. The story is real.
A charge point earns nothing while it is switched off. It just keeps costing.
One of the world’s largest energy companies was rolling out a national EV charging network. Thousands of units in the ground, thousands more coming, spread across a whole country. Field teams knew their own patch. Nobody could answer the two questions that decided whether the network made money.
Where should the next charger go? And how many of the ones we already own are working right now?
Why those two questions are the whole business
A charge point is a small factory with one product. Its return is set by two numbers, and they behave very differently.
Where you put it, you decide once. Concrete, cable, a grid connection, a permit, a lease. Once the unit is in the ground you cannot move it toward the demand — you have bought that location’s traffic for the whole life of the asset. Siting is not a property decision. It is capital allocation, and it is irreversible.
Whether it works, you decide every day. And this is the part that hides. A dead charger does not send you an invoice. It quietly stops earning while depreciation, grid connection charges and site rent carry on exactly as before. Nothing in the accounts turns red. The revenue simply never arrives, and no line item explains why.
That is why uptime is a financial metric, not a technical one. At this scale, a few percentage points of downtime across the estate is a seven-figure question.
Planning where the network goes
We built the allocation model for the rollout — matching planned sites against demand, available grid capacity, permit timelines and existing coverage, so that every unit went where it would earn rather than where it was easiest to build.
That work ran straight into the real bottleneck. It was never construction. It was permits and grid connections, which meant the constraint sat with national and municipal authorities. So a large part of the job was working with government: getting sites approved, connections scheduled, and timelines that the build programme could actually plan against.
Building four times faster
With the pipeline unblocked, the build rate became the limit. We renegotiated contractor terms and rebuilt the scheduling around them — crews, materials and site readiness sequenced so that teams were not standing idle waiting on a permit or a part.
Installations per day increased fourfold.
One system for 18,000 assets
Then the harder half. A network only earns if the units are on, and you cannot manage what you cannot see. We designed and implemented the asset tracking system for the estate — more than 18,000 assets, each with its own record: installation date, warranty position, fault history, service history and running cost.
That record is what turns maintenance from reactive to proactive. Instead of learning a charger was down when a customer complained, patterns in the data showed which units were heading for failure, and crews were sent before the unit stopped rather than after. Warranty claims stopped being missed. Repeat faults stopped being treated as new ones.
The approach was recognised internally as best practice and adopted as the reference model by teams in other European countries.
The result
€1.3M+ in annual savings — from proactive maintenance, renegotiated contractor terms and fault costs that stopped repeating.
98% asset uptime — the estate earning almost all of the time it was capable of earning.
4× the build rate — same teams, sequenced against the real constraint.
Exported as the group standard — the asset system used as the example across other European operations.
What this transfers to any asset-heavy business
Downtime is a cost that never appears as a cost. Nothing in your accounts flags an asset that has quietly stopped earning. If you do not measure uptime, you are not measuring it at all.
Placement decisions are permanent ones. Anything you cannot move later — a site, a lease, a machine — should be argued through the numbers before the concrete, not after.
Find the real constraint before you optimise. Here it was permits, not crews. Speeding up the part that was not the bottleneck would have changed nothing.
You cannot manage assets you cannot see. One record per asset, with cost and fault history attached, is what makes maintenance a decision instead of a reaction.
Volume plus data is negotiating power. Contractor rates move when you can show exactly what you are buying and how much of it.
Curious what a Money X-Ray would find in your numbers?
Details have been changed to protect the client’s confidentiality. The story is real.
Close to €1 million of the owner’s money was sitting on shelves.
Eight grocery stores in the Benelux, each run as its own small business — its own supplier arrangements, its own cash drawer, its own opinion about what to stock. No consolidated accounts of any kind: no single P&L, no cash flow statement, no balance sheet. When the owner wanted to know how the chain was doing, he looked at the bank balance.
And he wanted to sell.
Why that combination is expensive
A buyer does not pay for revenue. A buyer pays a multiple of EBITDA — earnings before interest, taxes, depreciation and amortisation. Roughly: what the business itself earns, stripped of how it happens to be financed and what it owns on paper. It is the closest thing to what this will earn in someone else’s hands.
Two things follow from that, and they compound.
Every euro of EBITDA is worth several euros of sale price. At a multiple of five, €100,000 of annual profit you never found is €500,000 you never got paid. Profit left on the table does not cost you once. It costs you the multiple.
EBITDA you cannot prove does not count. Due diligence discounts any number that is not produced by a system, and discards the ones it cannot trace at all. Eight cash drawers and a bank balance are not a system. A buyer looking at that does not negotiate the price down — he assumes the worst, or walks.
So the chain had both problems at once. Profit was lower than it should have been, and the profit that did exist could not be evidenced.
Step one: one set of books for eight shops
Before you can fix anything, you have to see it. We built the reporting layer first — a consolidated P&L, cash flow statement and balance sheet for the chain, plus a goods management system so that stock, purchases and margin were recorded the same way in every store.
The point was not the reports. The point was that for the first time the eight stores could be compared with each other, and with themselves last month. That is when the picture appeared. Three things were quietly eating the profit.
Purchasing ran on instinct. Each store ordered on its manager’s sense of what would sell. Some of that instinct was good. But nobody measured how many days stock took to turn back into cash, so slow lines were reordered simply because the shelf looked empty. That is where the million was — not in one bad decision, but in hundreds of small reorders nobody was counting. In grocery, part of that stock does not just sit. It expires.
Promotions ran without margin maths. Prices were set against competitors, not against cost. Several of the most heavily promoted lines were selling in volume below the margin needed to cover the cost of selling them. The chain was working hard to lose money faster.
One location could not carry its own rent. In a pooled view, a weak store hides behind strong ones. Split by location, it was obvious which store the others had been subsidising, and for how long.
Step two: fixing it
Nothing exotic. The work was in doing it consistently.
Stock turnover analysis. Every line ranked by how many days it takes to turn back into cash. Slow lines flagged, cleared, and taken out of the reorder pattern.
A floor margin on every promotion. If a promotion did not clear it, it did not run. Loss-making ones were stopped; a few were repriced and kept.
Purchasing tied to the numbers. Reorder decisions moved from instinct to turnover data, store by store.
A P&L for each location. The weak store became a decision the owner could actually make, rather than a feeling he had.
Reporting a buyer would accept. P&L, cash flow and balance sheet produced the same way every month, from one system, traceable to source.
The result
EBITDA up 24.2%.
Not from one clever move — from three ordinary ones done at the same time: stock that stopped sitting still, promotions that stopped selling at a loss, and a location decision that stopped being postponed.
The second result mattered as much to an owner who was selling. The numbers now come out of one system, which is the difference between telling a buyer what the business earns and showing him. The chain is exit-ready. Whether to sell is the owner’s decision — and it is now a decision rather than a hope.
If you are heading for a sale, do this early
Build the reporting before you need it. A buyer trusts twelve months of consistent numbers. He does not trust a spreadsheet assembled the month he asked for one.
Split the P&L by location. A chain is not one business. Every store either carries itself or is carried, and you cannot know which until you look.
Measure stock turnover, not stock value. The question is not how much stock you have. It is how many days your money spends on the shelf.
Put a floor margin on every promotion. If it does not clear the floor, it is not marketing. It is a donation.
Fix EBITDA before you fix the price. Every euro of profit you find before the sale is worth the multiple. Every one you find after it belongs to the buyer.
Curious what a Money X-Ray would find in your numbers?